
Statistics and data-driven content consistently perform well on Pinterest because people trust numbers.
Whether you’re sharing research findings, industry trends, benchmark reports, survey results, marketing insights, AI adoption statistics, SEO studies, or business metrics, data pins can attract highly engaged audiences looking for credible information.
Pinterest users frequently save and share data-rich content because it helps them make better decisions, support arguments, and stay informed about trends.
Adobe Express makes it easy to create professional Statistics and Data Pins using:
- Pinterest templates
- Brand Kits
- AI-powered design tools
- Adobe Stock assets
- Charts and graphs
- Fast export workflows
In this guide, you’ll learn how to create Pinterest Statistics and Data Pins using Adobe Express.
What Are Pinterest Statistics and Data Pins?
Statistics and Data Pins are Pinterest graphics that highlight important numerical information.
Examples include:
AI Industry Statistics
Social Media Trends
SEO Benchmarks
Email Marketing Results
E-Commerce Growth Data
Productivity Research
Consumer Behavior Reports
Technology Adoption Trends
The goal is to present information in a visually engaging format that encourages clicks, saves, and shares.
Why Data Pins Perform Well
People trust evidence.
Benefits include:
High Credibility
Statistics add authority.
Strong Save Rates
Users often bookmark useful data.
Shareability
Facts and trends are frequently shared.
Traffic Generation
Users want the full report.
Thought Leadership
Data-driven content positions you as an expert.
Research-backed content often outperforms opinion-based content.
Best Topics for Statistics Pins
Popular categories include:
Artificial Intelligence
Marketing
SEO
Blogging
Social Media
E-Commerce
Business Growth
Productivity
Technology
Consumer Trends
Choose topics with meaningful, actionable data.
Recommended Pinterest Pin Size
Pinterest recommends:
1000 × 1500 Pixels
2:3 Vertical Format
Adobe Express includes Pinterest-ready layouts optimized for readability.
Step 1: Open Adobe Express
Sign in to Adobe Express.
From the dashboard:
Click Create New
or
Search Pinterest Templates
Adobe Express offers numerous infographic and report-style layouts.
Step 2: Choose a Data-Focused Template
Browse categories such as:
Infographics
Reports
Statistics
Research
Business
Marketing
Choose a layout that emphasizes clarity.
Step 3: Create a Strong Headline
Examples:
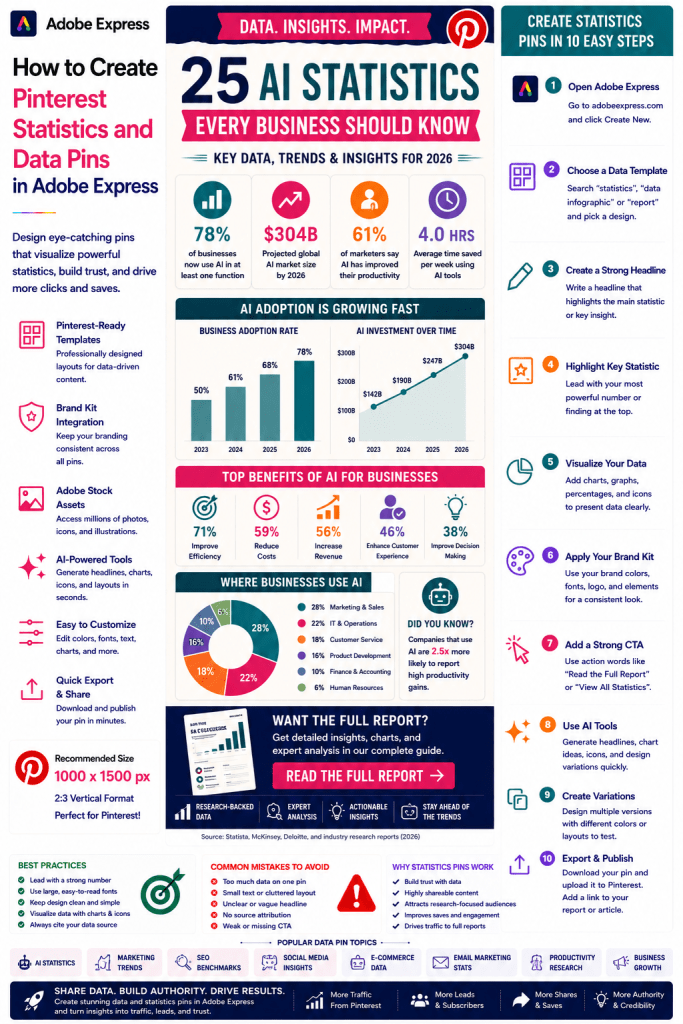
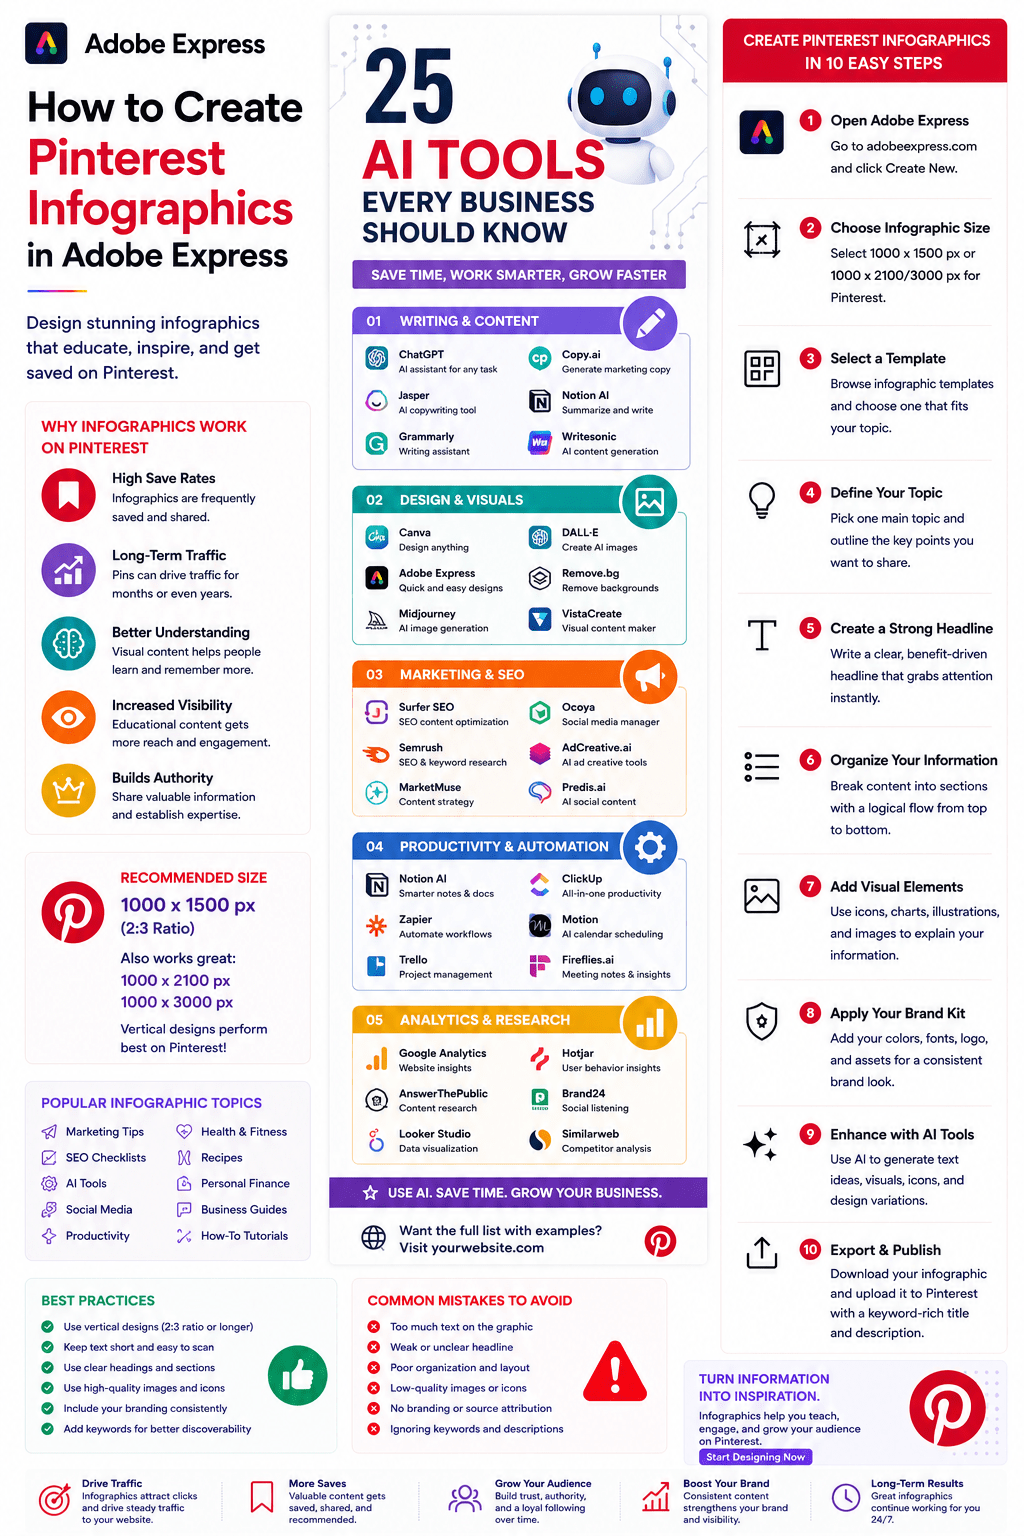
25 AI Statistics Every Business Should Know
SEO Trends for 2026
Social Media Marketing Statistics
E-Commerce Growth by the Numbers
The State of AI Adoption
A strong headline creates curiosity.
Step 4: Highlight the Most Important Statistic
Lead with your strongest number.
Examples:
78% of Businesses Use AI
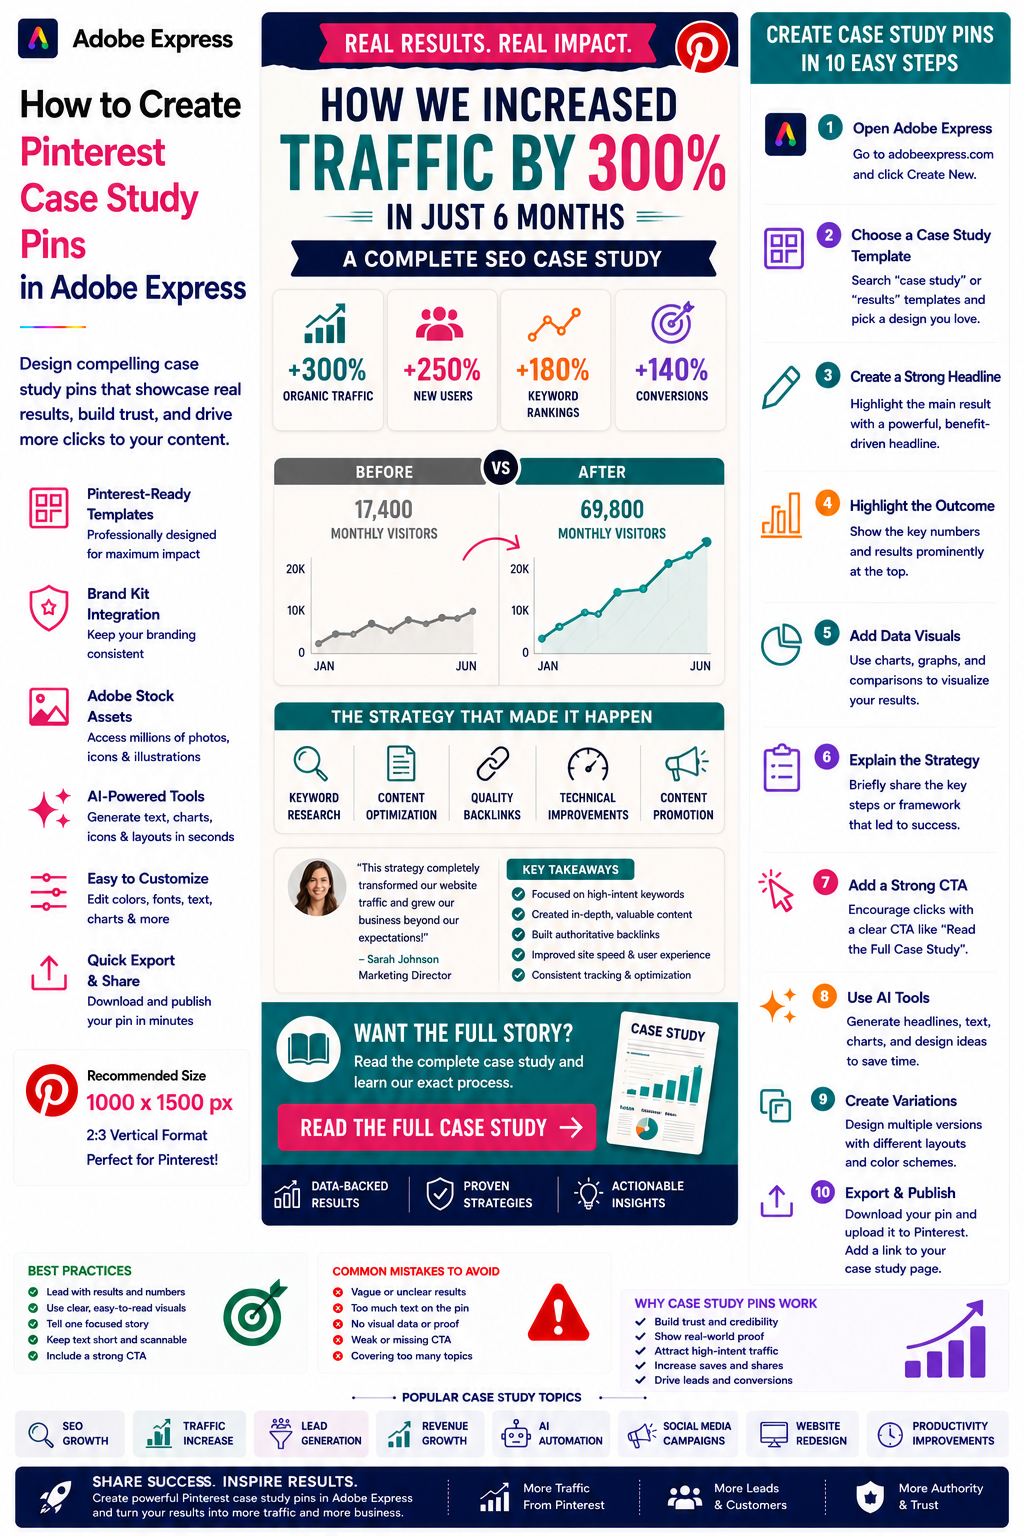
320% Growth in Organic Traffic
65% Higher Conversion Rate
4X Increase in Productivity
The primary statistic should dominate the design.
Step 5: Use Visual Data Elements
Examples:
Bar Charts
Pie Charts
Trend Lines
Percentages
KPI Blocks
Comparison Graphics
Visualizing data improves understanding.
Step 6: Apply Your Brand Kit
Adobe Express Brand Kits simplify consistency.
Apply:
Brand Colors
Brand Fonts
Logos
Design Assets
Consistent branding strengthens recognition.
Step 7: Simplify Complex Data
Pinterest users scan quickly.
Focus on:
Key Findings
Main Trends
Critical Insights
Actionable Takeaways
Avoid overwhelming users with excessive detail.
Step 8: Use Adobe Express AI Features
Adobe Express AI tools can generate:
Headlines
Chart Concepts
Design Variations
Infographic Layouts
Visual Summaries
AI can significantly speed up content creation.
Step 9: Add a Strong Call-to-Action
Examples:
Read the Full Report
View All Statistics
Explore the Research
Download the Study
Learn More
A CTA encourages clicks.
Step 10: Export and Publish
When complete:
Save Project
Download Pin
Create Variations
Upload to Pinterest
Your Statistics Pin is ready.
Creating AI Statistics Pins
Examples:
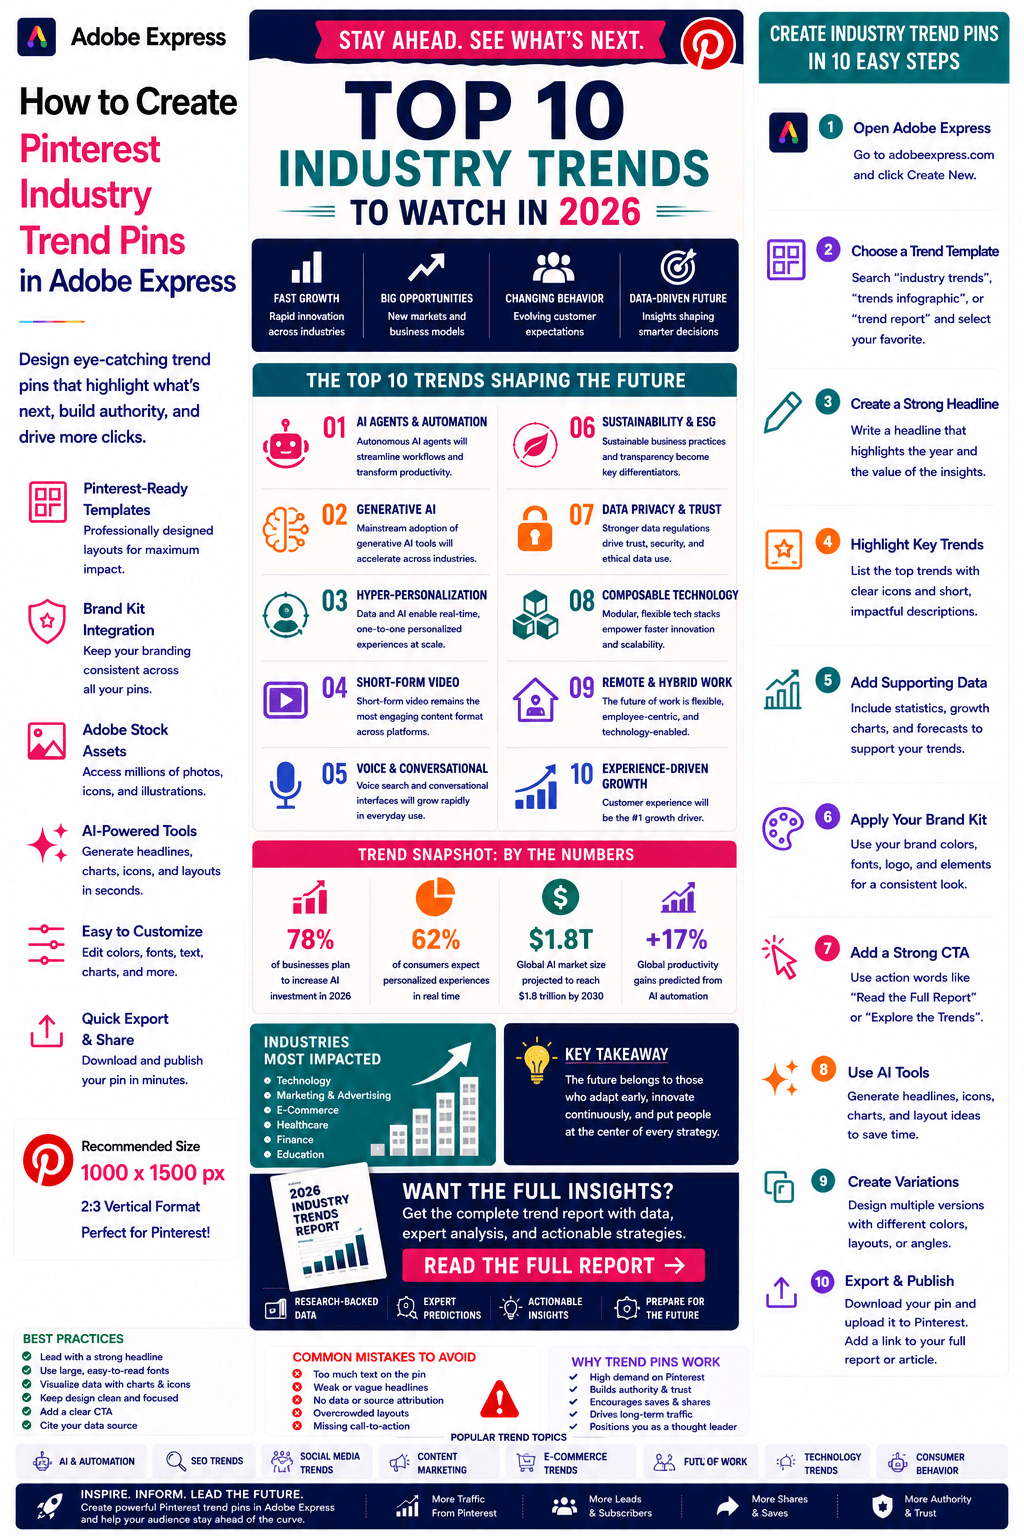
AI Adoption Rates
LLM Usage Trends
AI Investment Growth
Agentic AI Statistics
Automation Research
AI data remains highly popular.
Creating Marketing Statistics Pins
Examples:
Email Marketing Benchmarks
Lead Generation Data
Content Marketing Statistics
Conversion Rate Trends
Marketers frequently save and share this content.
Creating SEO Data Pins
Examples:
Ranking Factor Studies
Search Traffic Research
Click-Through Rate Benchmarks
Keyword Trend Analysis
SEO professionals actively seek data-driven insights.
Creating Social Media Statistics Pins
Examples:
LinkedIn Growth Trends
Pinterest User Data
Instagram Engagement Benchmarks
X (Twitter) Marketing Statistics
Social media data performs extremely well.
Creating Business Research Pins
Examples:
Startup Statistics
Small Business Trends
Productivity Research
Customer Behavior Studies
Business audiences value evidence-based content.
Best Practices for Data Pins
Lead With the Strongest Statistic
Capture attention immediately.
Use Large Numbers
Improve visibility.
Visualize Data
Charts communicate faster than text.
Focus on Key Insights
Keep information digestible.
Include a CTA
Drive traffic to the full report.
These practices improve performance.
Common Data Pin Mistakes
Too Much Data
Creates information overload.
Tiny Charts
Hard to read on mobile devices.
Weak Headline
Reduces engagement.
Poor Data Visualization
Makes information confusing.
Missing Source Attribution
Can reduce credibility.
Avoiding these mistakes improves results.
Example Workflow
Imagine promoting a report.
Headline
25 AI Statistics Every Business Should Know
Main Statistic
78% of Businesses Now Use AI
Supporting Data
- Adoption Growth
- Investment Trends
- Productivity Gains
CTA
Read the Full Report
This structure performs exceptionally well on Pinterest.
Why Adobe Express Is Ideal for Statistics Pins
Adobe Express combines:
Professional Templates
Brand Management
AI Design Tools
Infographic Layouts
Easy Editing
Fast Export
Pinterest-Friendly Formats
This makes it one of the easiest tools for creating data-focused Pinterest content.
Conclusion
Pinterest Statistics and Data Pins are highly effective for building authority, sharing research, generating traffic, and establishing thought leadership.
By combining templates, Brand Kits, AI-powered tools, and streamlined workflows, Adobe Express enables creators and businesses to create professional data-driven pins quickly and consistently.
Whether you’re publishing AI trends, marketing benchmarks, SEO studies, or business research, Adobe Express provides everything needed to create high-performing Statistics and Data Pins.
Continue Learning Adobe Express
To learn more about Pinterest marketing, explore these guides:
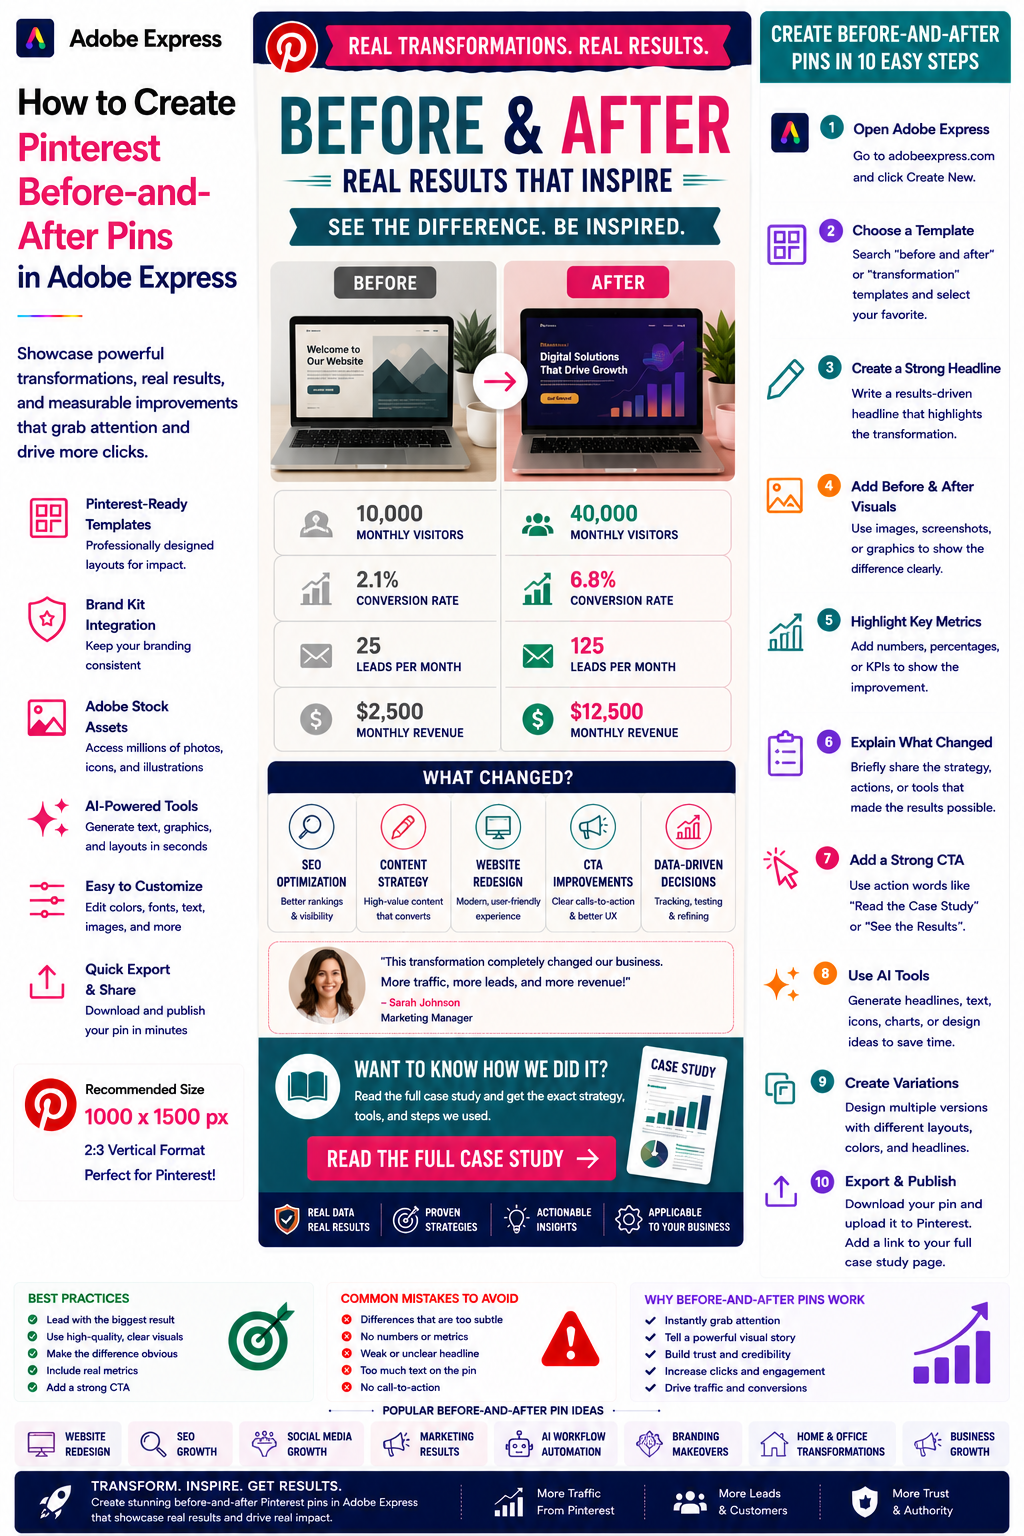
- How to Create Pinterest Before-and-After Pins in Adobe Express
- How to Create Pinterest Case Study Pins in Adobe Express
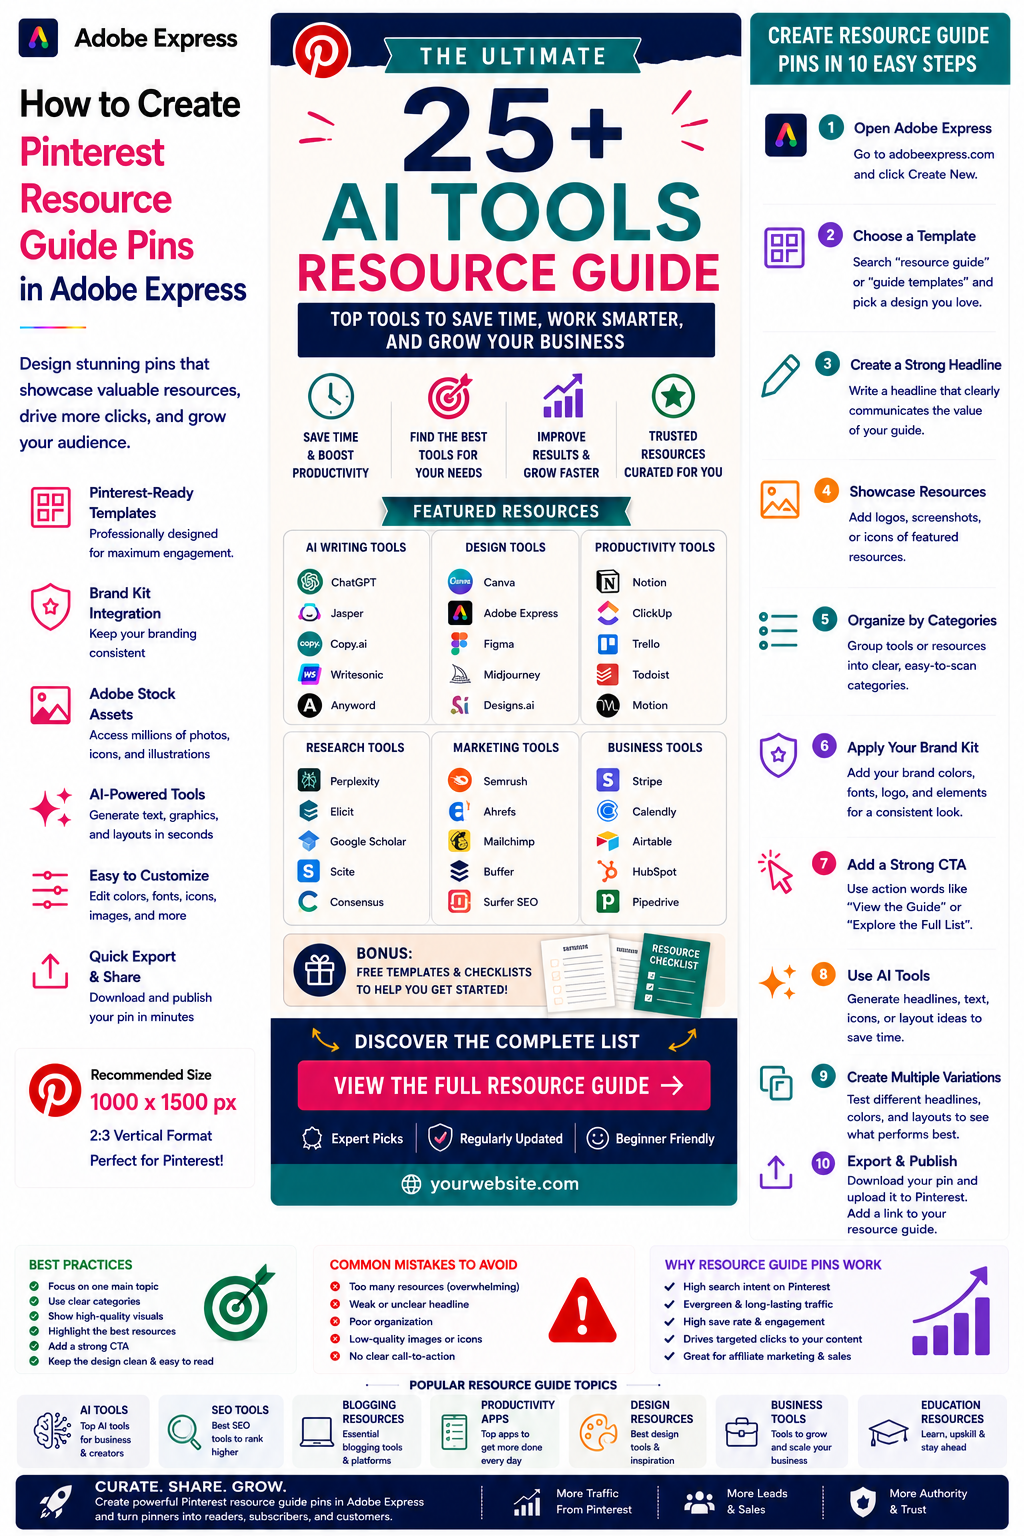
- How to Create Pinterest Resource Guide Pins in Adobe Express
For advanced marketing workflows, also read:

